Admin
System Logs
The System Logs page (/admin/system-logs) shows the application's error log — every unhandled exception, every error-level log line, every backend-detected anomaly.
What's logged
- Unhandled exceptions in tRPC handlers
- Database query failures
- External API errors (Hospitable, Nuki, WhatsApp Cloud API)
- Validation failures that escaped the boundary
app_errorsrows written explicitly by application code (e.g. silent-skip notifications, condition-not-met logs)
Columns
- Timestamp
- Severity — error / warn / info
- Source — module or service that emitted the log
- Message — human-readable summary
- Context — JSON blob with structured fields (reservation ID, task ID, user ID, stack trace)
- Acknowledged — whether an admin has acknowledged this row
Filters
- Severity
- Source
- Date range
- Acknowledged / not
Acknowledging
Click Acknowledge on a row to mark it triaged. Acknowledged rows are hidden from the default view but remain in the database for audit.
⚠ Don't acknowledge as a way to make a problem go away — acknowledge as a record that you've seen and decided on it (filed an issue, fixed the bug, or determined it's noise).
Reading the log when there's been an incident
- Filter to the time window of the incident.
- Filter severity to error.
- Click into rows to see the structured context.
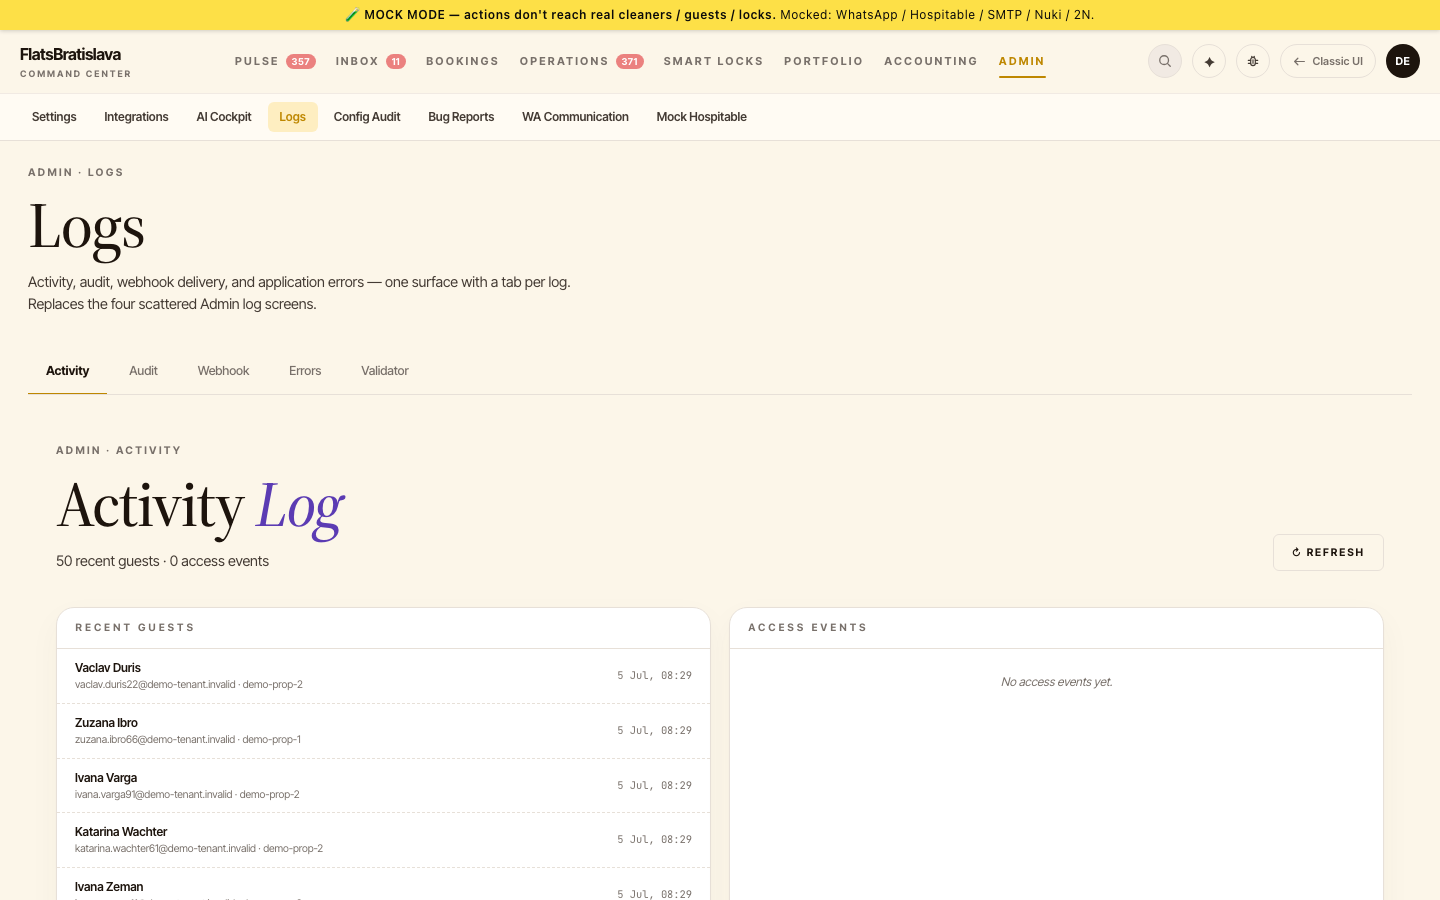
- Note the reservation IDs / task IDs that appear; cross-check with Activity Log for the surrounding context.
Expected volume
Errors are deduplicated and validation-error noise doesn't write to app_errors — the table stays in the low double-digits under normal operation.
If you see a sudden spike (>50 new error rows in an hour), something is wrong — file an incident.
Source: the luxury.host operator manual.